How to use Flowcharts in Project Management

A common flowchart is a great management tool, which details complex processes most intuitively. In other words, it enhances internal communication with a more understandable common language. Nowadays, managers can create flowcharts easily with many free flow chart creator, such as Zen Flowchart.
Besides, this tool offers some other great benefits based on its impact on the workload. For example:
- Point out hidden inefficiencies
- Remove the bottlenecks
- Promote an upgrade in service or production
- Works as a training material
Regardless of level, no one can deny such wonderful advantages of flowcharts. With this preeminence, business owners often start with the macro category for changes from the inside out. How to use flowcharts in project management – We have got a detailed guide below.
Project Initiation
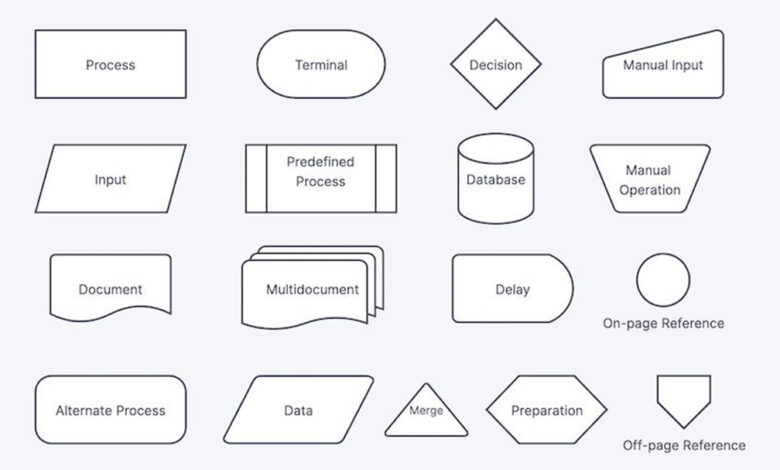
This process usually begins when your company completes a Project Charter that aggregates from initialization forms. However, it is the second geometry in your flowchart. Meanwhile, the first step, labeled Initiation, indicates the name.
According to the submission flow to senior management or sponsors, the presentation illustrates development in two different directions. If the stakeholders approve your recommendation, the central location leads to the next step – establishment. Otherwise, the plan requires adjustments and review or ends at this point.
New Project Planning
The seeding of an idea is never an easy journey, but it may face fewer challenges with flowcharts. Usually, experts highly recommend the starting point set by clarifying the goal and scope of development. This leads the presentation to different stages of preparation, such as tracking stats, scorecards, etc. All of these requirements ultimately boil down to overarching project plans.
However, it does not come to a halt here. A few critical subsets of elements should go further to speed up this phase.
If you have no idea, it is best to think of key execution components, namely budget, human resources, timeline, etc. Once you have gathered these lists, your flowchart records a significant development – the dense appearance of new categories (communication, risk management, quality control, etc.).
In this stage, it is a burden to go directly into each in-depth content (this should take place in the project implementation phase mentioned in the next section). Finally, this map goes through a decision-approval phase. If successful, it leads to execution or cancellation otherwise.
Project Execution
As noted above, this phase moves into the detailing of development. Hence, the main goal of the flowchart is to smooth communication and enhance control quality. Like the period above, your plan goes through three individual steps with any action: set – adapt – cancel or adjust.
Depending on your purpose, the map can be implemented in various directions. For example, a Swimlane flowchart, created with flowchart symbols, is ideal for allocating responsibilities to project participants. It aggregates all the duties of managers, developers, and employees. Regardless of vertical or horizontal division, the visual tool is always the greatest option to demonstrate cross-functionality.
In the case of progress tracking, the flowchart should include important milestones, timelines, costs, and budget data.
Project Monitoring
This stage should not be done on a whim or out of sequence. In other words, the activity logic gives you the best supervision. As such, none other than the process flowchart helps you achieve this goal. The clear sequence of steps guides the business order and schedule of work. In addition, it can predict potential risks.
Your map must provide enough information to achieve the best results. Case in point, you can deploy an integrated change control plan to monitor, update, report risks and implement countermeasures. This method assists companies in responding to change and omissions as quickly as possible.
Project Development
Developing a project entails adding an essential task or goal that arises during work to complete the whole program. Like the visual diagrams for execution, the appropriate one for this period is usually a Swimlane in any direction.
Start your map with a new mission and reorganize the priority of all. Right after that, your business can proceed with the relevant steps, including developing, deploying, testing, and completing.
Project Closing
Even when the program concludes, it is not an instant action. This means that a business can leverage flowcharts to speed things up. List activities that compare performance with project goals and deliverables.
Then it puts a perfect ending if you add lessons and experiences during your process. These operational details show an improvement in quality management and project team productivity.
The Whole Project Management
It is time to go back to a comprehensive point of view which may be overwhelming for management due to piles of data. Luckily, once again, the flowchart came to change the game.
Administration diagrams provide an informative visualization. Depending on the business demands, your map can be compiled in many ways. Feel free to deploy according to macro elements such as documents, tasks, and timelines.
Following the flow, the first leads to areas of budgets, schedules, and periodic status reports. Meanwhile, the second gathers some project phases as mentioned above.


